January Home sales Surge
January Home sales Surge
WASHINGTON (February 18, 2022) – Existing-home sales rose in January, making a notable move upward following a previous month where sales declined, according to the National Association of Realtors®. On a month-over-month basis, each of the four major U.S. regions experienced an increase in sales in January. However, year-over-year, activity was mixed as two regions reported sagging sales, another watched sales increase and a fourth region remained flat.
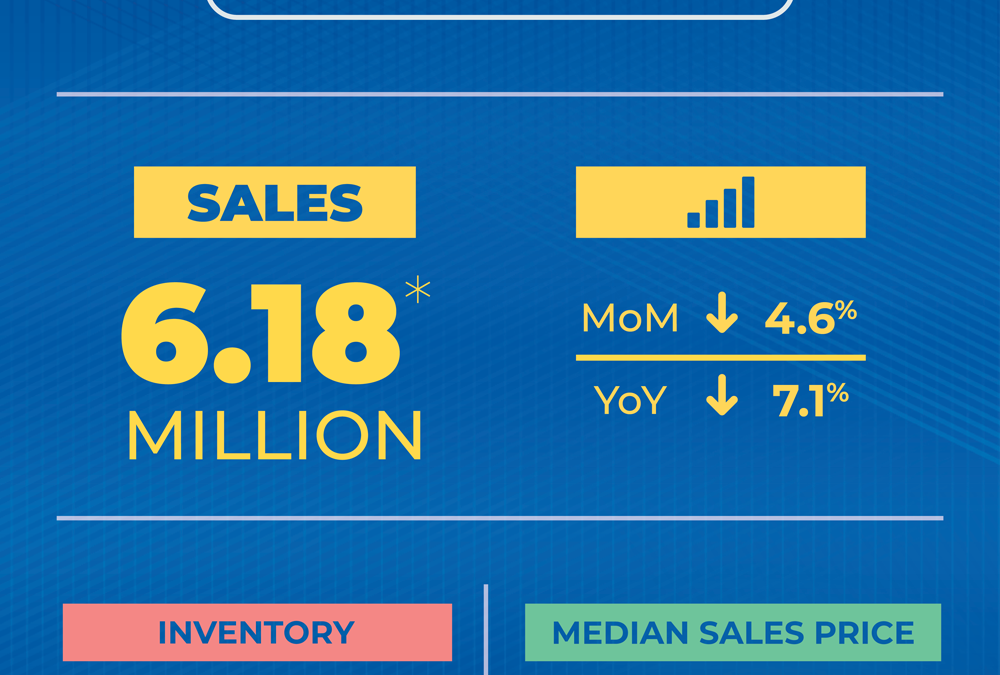
Total existing-home sales,1 https://www.nar.realtor/existing-home-sales, completed transactions that include single-family homes, townhomes, condominiums and co-ops, climbed 6.7% from December to a seasonally adjusted annual rate of 6.50 million in January. Year-over-year, sales fell 2.3% (6.65 million in January 2021).
“Buyers were likely anticipating further rate increases and locking-in at the low rates, and investors added to overall demand with all-cash offers,” said Lawrence Yun, NAR’s chief economist. “Consequently, housing prices continue to move solidly higher.”
Total housing inventory2 at the end of January amounted to 860,000 units, down 2.3% from December and down 16.5% from one year ago (1.03 million). Unsold inventory sits at a 1.6-month supply at the current sales pace, down from 1.7 months in December and from 1.9 months in January 2021.
“The inventory of homes on the market remains woefully depleted, and in fact is currently at an all-time low,” Yun said.
According to Yun, homes priced at $500,000 and below are disappearing, while supply has risen at the higher price range. He noted that such increases will continue to shift the mix of buyers toward high-income consumers.
“There are more listings at the upper end – homes priced above $500,000 – compared to a year ago, which should lead to less hurried decisions by some buyers,” Yun added. “Clearly, more supply is needed at the lower-end of the market in order to achieve more equitable distribution of housing wealth.”
The median existing-home price3 for all housing types in January was $350,300, up 15.4% from January 2021 ($303,600), as prices rose in each region. This marks 119 consecutive months of year-over-year increases, the longest-running streak on record.
Properties typically remained on the market for 19 days in January, equal to days on market for December, and down from 21 days in January 2021. Seventy-nine percent of homes sold in January 2022 were on the market for less than a month.
First-time buyers were responsible for 27% of sales in January, down from 30% in December and down from 33% in January 2021. NAR’s 2021 Profile of Home Buyers and Sellers – released in late 20214 – reported that the annual share of first-time buyers was 34%.
Yun explained that the forthcoming increase in mortgage rates will be problematic for at least two market segments.
“First, some moderate-income buyers who barely qualified for a mortgage when interest rates were lower will now be unable to afford a mortgage,” he said. “Second, consumers in expensive markets, such as California and the New York City metro area, will feel the sting of nearly an additional $500 to $1000 in monthly payments due to rising rates.”
Individual investors or second-home buyers, who make up many cash sales, purchased 22% of homes in January, up from 17% in December and from 15% in January 2021. All-cash sales accounted for 27% of transactions in January, up from 23% in December and from 19% in January 2021.
Distressed sales5 – foreclosures and short sales – represented less than 1% of sales in January, equal to the percentage seen in both December and January 2021.
According to Freddie Mac, the average commitment rate for a 30-year, conventional, fixed-rate mortgage was 3.45% in January, up from 3.10% in December. The average commitment rate across all of 2021 was 2.96%.
Single-family and Condo/Co-op Sales
Single-family home sales jumped to a seasonally adjusted annual rate of 5.76 million in January, up 6.5% from 5.41 million in December and down 2.4% from one year ago. The median existing single-family home price was $357,100 in January, up 15.9% from January 2021.
Existing condominium and co-op sales were recorded at a seasonally adjusted annual rate of 740,000 units in January, up 8.8% from 680,000 in December and down 1.3% from one year ago. The median existing condo price was $297,800 in January, an annual increase of 10.8%.
“The market is still thriving as an abundance of home sales took place in January,” said NAR President Leslie Rouda Smith, a Realtor® from Plano, Texas, and a broker associate at Dave Perry-Miller Real Estate in Dallas. “We will continue to beat the drum for more inventory, which will give buyers additional options and will also help alleviate increasing costs.”
Regional Breakdown
Existing-home sales in the Northeast grew 6.8% in January, posting an annual rate of 780,000, an 8.2% decline from January 2021. The median price in the Northeast was $382,800, up 6.0% from one year ago.
Existing-home sales in the Midwest rose 4.1% from the prior month to an annual rate of 1,510,000 in January, equal to the level seen from a year ago. The median price in the Midwest was $245,900, a 7.8% rise from January 2021.
Existing-home sales in the South jumped 9.3% in January from the prior month, reporting an annual rate of 2,940,000, a gain of 0.3% from one year ago. The median price in the South was $312,400, an 18.7% surge from one year prior. For the fifth straight month, the South witnessed the highest pace of appreciation.
“The migration to the Southern states is clearly getting reflected in higher home sales and fast rising home prices compared to other regions,” Yun said.
Existing-home sales in the West increased 4.1% from the previous month, registering an annual rate of 1,270,000 in January, down 6.6% from one year ago. The median price in the West was $505,800, up 8.8% from January 2021.
The National Association of Realtors® is America’s largest trade association, representing more than 1.5 million members involved in all aspects of the residential and commercial real estate industries.
# # #
For local information, please contact the local association of Realtors® for data from local multiple listing services (MLS). Local MLS data is the most accurate source of sales and price information in specific areas, although there may be differences in reporting methodology.
NOTE: NAR’s Pending Home Sales Index for January is scheduled for release on February 25, and Existing-Home Sales for February will be released on March 18; release times are 10:00 a.m. ET.
1 Existing-home sales, which include single-family, townhomes, condominiums and co-ops, are based on transaction closings from Multiple Listing Services. Changes in sales trends outside of MLSs are not captured in the monthly series. NAR benchmarks home sales periodically using other sources to assess overall home sales trends, including sales not reported by MLSs.
Existing-home sales, based on closings, differ from the U.S. Census Bureau’s series on new single-family home sales, which are based on contracts or the acceptance of a deposit. Because of these differences, it is not uncommon for each series to move in different directions in the same month. In addition, existing-home sales, which account for more than 90% of total home sales, are based on a much larger data sample – about 40% of multiple listing service data each month – and typically are not subject to large prior-month revisions.
The annual rate for a particular month represents what the total number of actual sales for a year would be if the relative pace for that month were maintained for 12 consecutive months. Seasonally adjusted annual rates are used in reporting monthly data to factor out seasonal variations in resale activity. For example, home sales volume is normally higher in the summer than in the winter, primarily because of differences in the weather and family buying patterns. However, seasonal factors cannot compensate for abnormal weather patterns.
Single-family data collection began monthly in 1968, while condo data collection began quarterly in 1981; the series were combined in 1999 when monthly collection of condo data began. Prior to this period, single-family homes accounted for more than nine out of 10 purchases. Historic comparisons for total home sales prior to 1999 are based on monthly single-family sales, combined with the corresponding quarterly sales rate for condos.
2 Total inventory and month’s supply data are available back through 1999, while single-family inventory and month’s supply are available back to 1982 (prior to 1999, single-family sales accounted for more than 90% of transactions and condos were measured only on a quarterly basis).
3 The median price is where half sold for more and half sold for less; medians are more typical of market conditions than average prices, which are skewed higher by a relatively small share of upper-end transactions. The only valid comparisons for median prices are with the same period a year earlier due to seasonality in buying patterns. Month-to-month comparisons do not compensate for seasonal changes, especially for the timing of family buying patterns. Changes in the composition of sales can distort median price data. Year-ago median and mean prices sometimes are revised in an automated process if additional data is received.
The national median condo/co-op price often is higher than the median single-family home price because condos are concentrated in higher-cost housing markets. However, in a given area, single-family homes typically sell for more than condos as seen in NAR’s quarterly metro area price reports.
4 Survey results represent owner-occupants and differ from separately reported monthly findings from NAR’s Realtors® Confidence Index, which include all types of buyers. Investors are under-represented in the annual study because survey questionnaires are mailed to the addresses of the property purchased and generally are not returned by absentee owners. Results include both new and existing homes.
5 Distressed sales (foreclosures and short sales), days on market, first-time buyers, all-cash transactions and investors are from a monthly survey for the NAR’s Realtors® Confidence Index, posted at nar.realtor.
Ready to make a Move?
Bardell Real Estate are the experts in helping you with your selling, buying or renting needs near Orlando, Florida. Make your Disney area experience a forever memorable one. Call us now to speak to a real estate agent.
[formlift id=”36911″]